I like making user interfaces and interactive data visualizations.
I'm a UX developer with a background in economics who designs and develops interfaces. I'm looking for data-driven projects where I can contribute my full range of analysis, design, and software development skills. Get in touch.
Portfolio
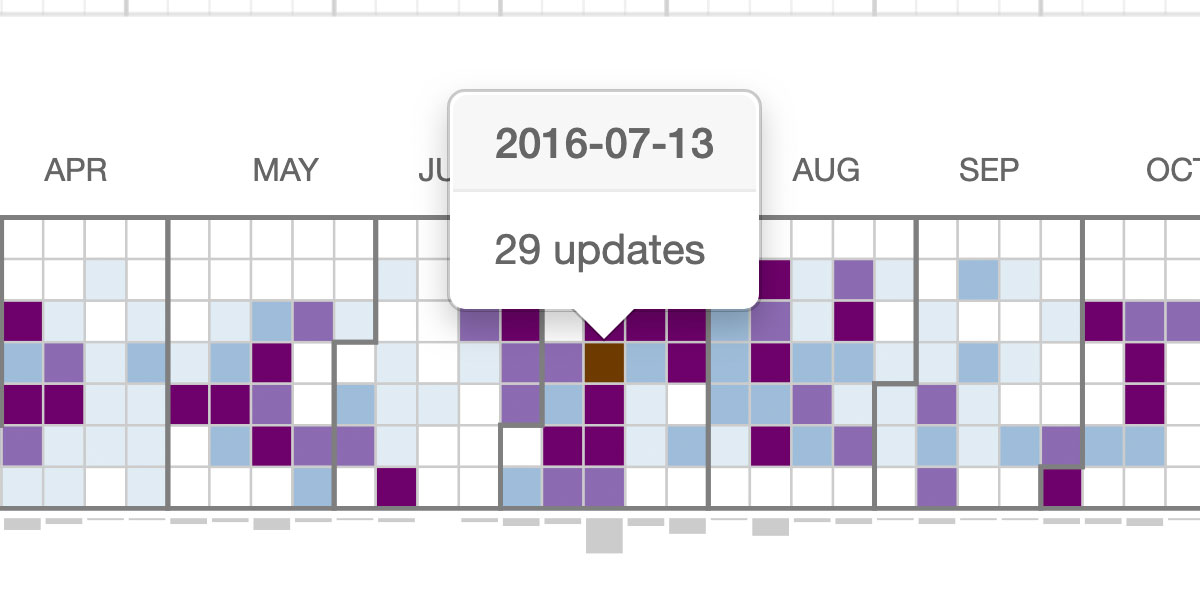
Policy Updates Heat Map Calendar
Displays daily, weekly, and day of week averages for when health policy updates are released.
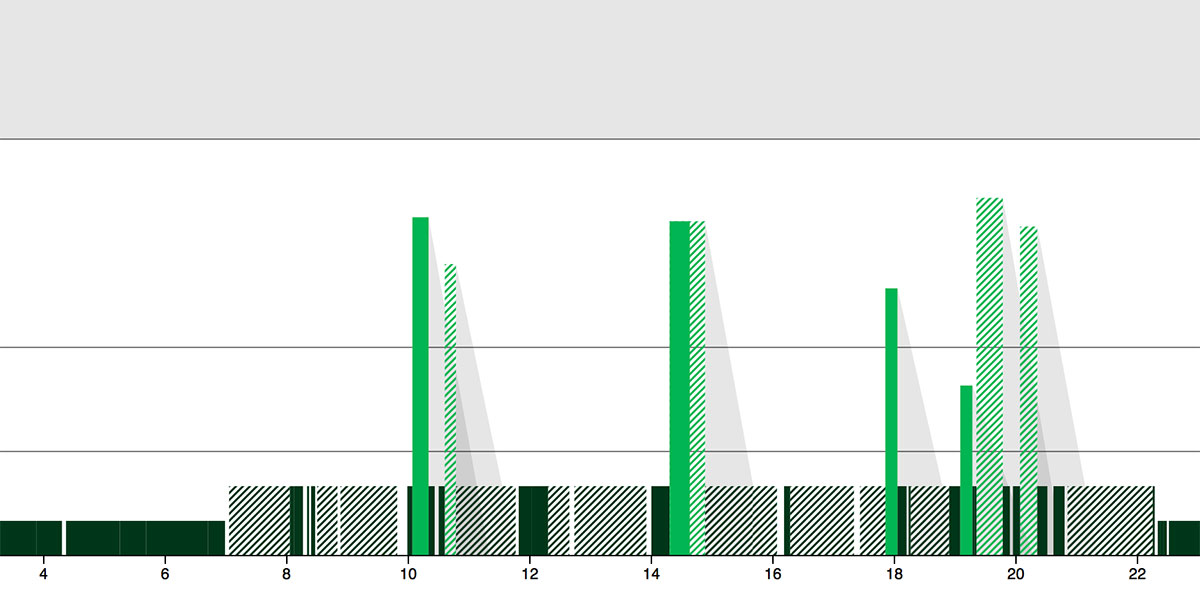
Fitbit for Arthritis
An interface that uses data from Fitbit devices to help people with arthritis achieve better health.
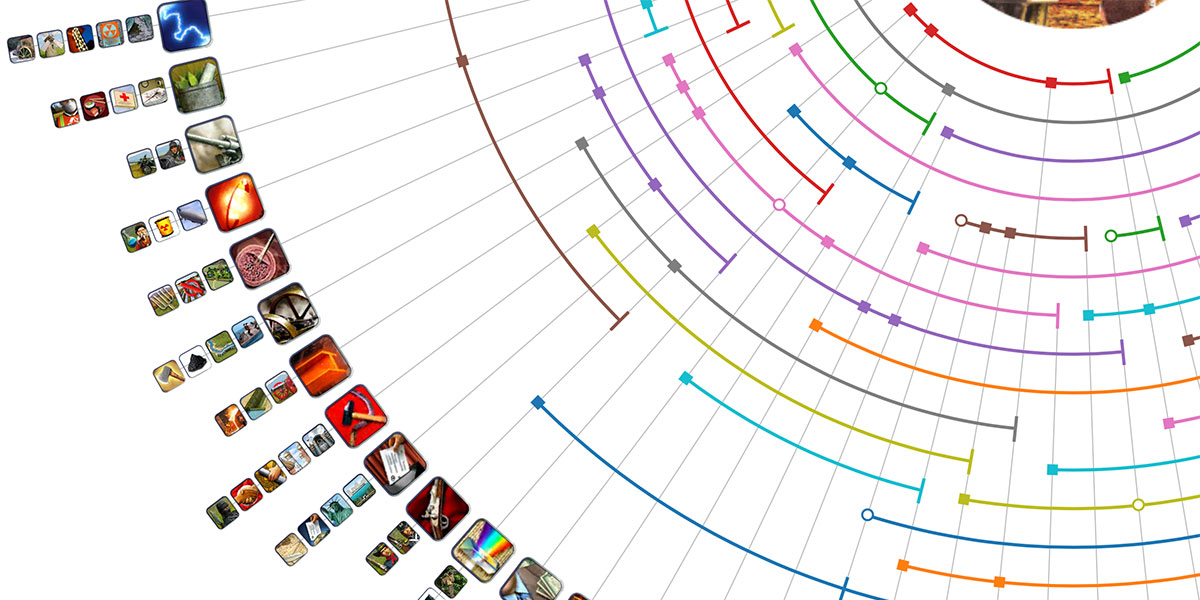
Civilization 4 Technology Wheel
A redesign of the technology trees in Sid Meier's Civilization for accuracy and clarity.
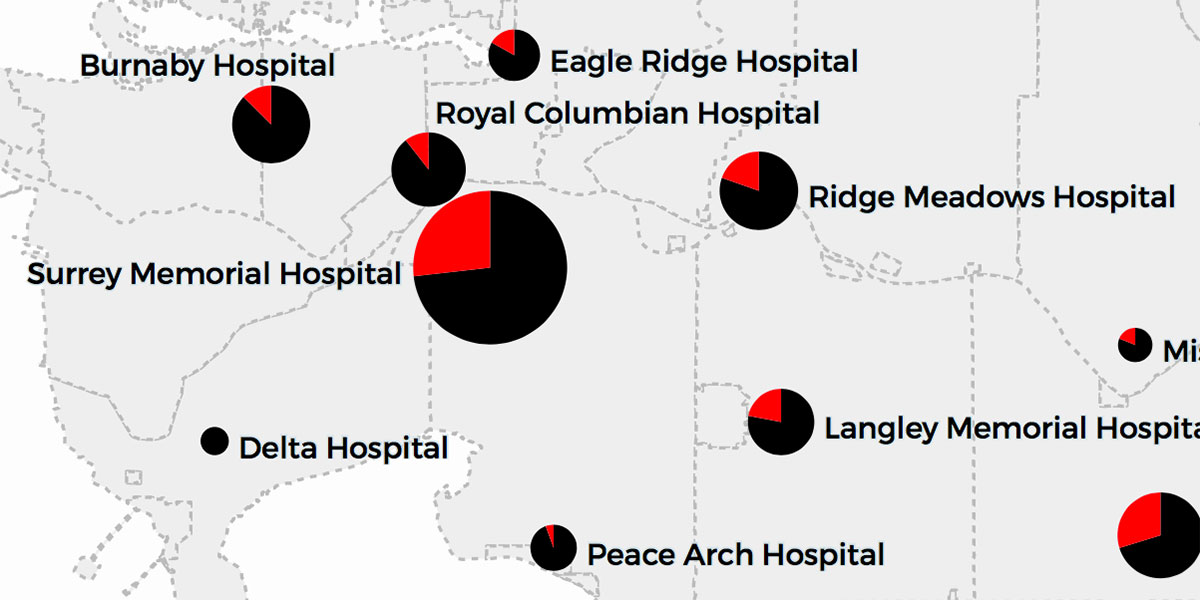
Valley of the Dolls
Interactive maps showing the crisis of opiate overdoses in the Fraser Valley of British Columbia, Canada.
SFU ApplyBC Upgrade
Improving the user experience of the online application forms for universities in British Columbia.

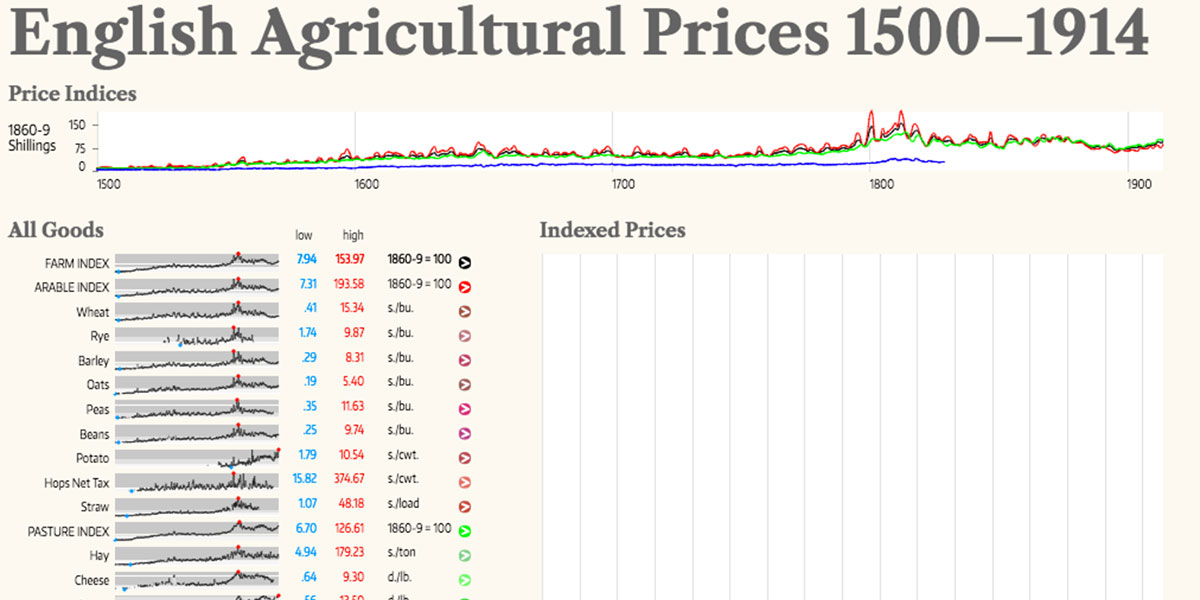
English Farm Prices History
An interactive data visualization for exploring historical economic farm data.
Typography Conference Pamphlet
A pamphlet for an imaginary typography conference on dingbats.
